
Coordinate Graph Paper Generator
Create printable coordinate graph paper with this free online maker. Set the X and Y coordinate range, choose how often numbers appear, add bold major grid lines, and place one or multiple Cartesian graphs on each page.
Customize the layout, download, and print for math lessons, worksheets, graphing practice, and more. For quick, easy and ready to download pre-made templates, visit our Grid Papers Gallery section.
X-Axis Range
Y-Axis Range
Graph Grid Layout
Min. Grid Spacing
Regular Line
Bold Line
Major Axis Lines
Axes Labels
Page Settings
Premium Features
Try this another version: Cartesian Graph Maker
Click Regenerate to apply any changes.
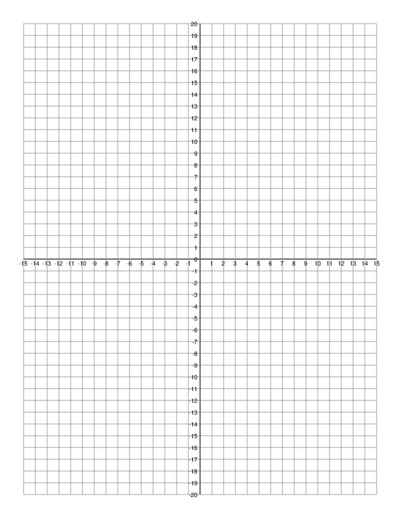
Select 'Custom' to enter your own values.
- 'Portrait Layout' : width will be smaller
- 'Landscape Layout' : height will be smaller
Pre-made Templates
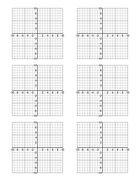
6 per page
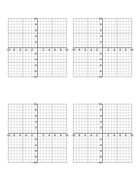
4 per page
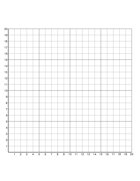
Single Coordinate
You may also like:
Post-it Notes

Cornell Square Grid Paper

Bricks Pattern Paper

Polar Graph with Degree Angles
Checklist
What is Coordinate Graph Paper?
Coordinate graph paper, also known as Cartesian graph paper or a coordinate plane, combines a square grid with horizontal and vertical axes.
The horizontal line is the X-axis, while the vertical line is the Y-axis. Where the two axes meet is called the origin, represented by (0, 0). When positive and negative values are included, the axes divide the coordinate plane into four quadrants.
Unlike ordinary square graph paper, coordinate paper provides clearly defined axes and can include numbered coordinates. This makes it easier to locate ordered pairs and graph mathematical relationships.
Uses of Coordinate Graph Paper
Coordinate graph paper is widely used in mathematics, but it can also be useful for science, data, design, and other activities.
Plotting Ordered Pairs: Plot coordinates such as (2, 4), (-3, 5), or (6, -2) and practice locating points in different quadrants.
Graphing Equations: Use the Cartesian grid for linear equations, quadratic equations, functions, inequalities, and other algebra activities.
Slope and Intercepts: Plot points and lines to practice slope, X-intercepts, Y-intercepts, and related concepts.
Coordinate Geometry: Draw shapes from coordinates and work with distance, position, and other geometry concepts.
Transformations: Use separate coordinate planes to practice translations, reflections, rotations, and enlargements.
Data and Science: Plot experimental measurements and other numerical data where values need to be shown against X and Y axes. Coordinate grids are commonly used for plotting data as well as mathematical functions.
Math Worksheets: Print several mini coordinate grids on one page for classroom exercises, quizzes, homework, or review sheets.
Coordinate Graph Paper Maker
Our Coordinate Graph Paper Maker lets you create custom Cartesian grids for plotting points, graphing equations, practicing coordinate geometry, and preparing math worksheets.
Instead of being limited to a ready-made coordinate plane, you can adjust the graph to fit your activity. Choose the number of grid spaces in the X and Y directions, control the coordinate range, show or hide numbers, and adjust how frequently the coordinates are labeled.
You can create one large coordinate plane or arrange several smaller graphs on the same sheet. This makes the maker useful for both individual graphing problems and worksheets that require students to complete several graphs.
Once you have the layout you need, generate the printable paper and download it for printing.
Customize Your Coordinate Grid
The maker gives you control over the layout of your printable graph paper.
Set the X and Y Range
Choose how far the coordinate plane extends horizontally and vertically. You can create common grids such as -5 to 5 or -10 to 10, or adjust the range to suit the problems you are working on.
Changing the X and Y ranges also lets you create graphs with more or fewer grid boxes.
Show or Hide Coordinate Numbers
Add coordinate numbers along the X and Y axes when you want a ready-to-use numbered graph.
For activities where students need to practice labeling the coordinate plane themselves, you can leave the numbers off and print a cleaner blank grid.
Skip Alternate Labels
Small coordinate graphs can become crowded when every grid position is numbered.
The label interval option lets you reduce this clutter. For example, instead of displaying every number, you can label every second or fifth coordinate while keeping the individual grid spaces.
This is especially useful when printing several coordinate planes on one page.
Bold Major Grid Lines
Make larger intervals easier to see by adding darker or thicker major grid lines.
For example, on a -10 to 10 coordinate plane, you can emphasize lines at intervals such as 5 units. The regular grid lines remain lighter while the major lines provide a clear visual reference.
The X- and Y-axes can remain more prominent so the origin and four quadrants are easy to identify.
Print Multiple Graphs Per Page
Choose how many coordinate grids you want on each sheet.
Create one large graph for detailed work, or arrange several smaller coordinate planes using layouts such as 1 × 2, 2 × 2, or 2 × 3.
This allows you to make printable sheets with:
- 1 coordinate graph per page
- 2 coordinate graphs per page
- 4 coordinate graphs per page
- 6 coordinate graphs per page
Multiple coordinate planes are particularly useful for worksheets and assignments containing several graphing questions. Similar coordinate-paper tools also use multi-grid layouts specifically for this purpose.
One Graph or Multiple Graphs?
Choose the number of graphs based on how much plotting space you need.
A single coordinate graph per page gives you the largest working area and is useful for detailed graphs, multiple plotted lines, and activities that require plenty of room for labels.
Two graphs are useful for comparing equations, functions, or before-and-after transformations.
Four graphs provide a good general-purpose worksheet layout, while six mini graphs are convenient for short exercises where students need to solve several separate graphing problems.
Why Use a Coordinate Graph Paper Generator?
Ready-made coordinate paper works well when its range and layout match your assignment. However, different math activities often need different graph sizes.
A generator gives you more flexibility. You can create a large numbered Cartesian plane for one problem, reduce the number of labels on a smaller grid, emphasize major intervals, or fit several graphs onto a single sheet.
This also makes it easier for teachers to prepare graphing worksheets without manually drawing and numbering every coordinate plane.
Customize the coordinate graph paper to match your activity, generate the layout, and download a clean printable version for classroom, homework, or personal use.
