Logarithmic Graph Paper
Download semi-log and log–log graph paper for scientific and engineering data plotting, including exponential, frequency, and growth curves.
Showing 1-7 of 7 records
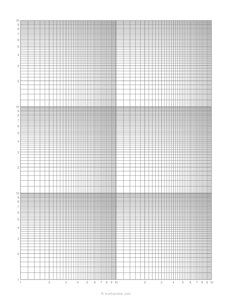
Log-Log Graph Paper (Multiple Cycles - 2×3)
Download multi-cycle log-log graph paper with multiple logarithmic cycles on single or both axes. Ideal for engineering, physics, and large-scale scientific data.
view detailscategory: Logarithmic Graph Paper
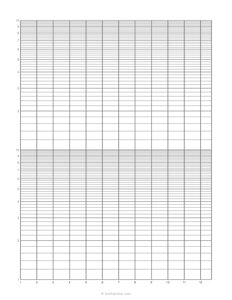
Semi-Log Graph Paper (2-Cycles on Y-Axis)
Print semi-log graph paper with two full logarithmic cycles on the Y-axis. Perfect for wide-range exponential data visualization and scientific graphs.
view detailscategory: Logarithmic Graph Paper
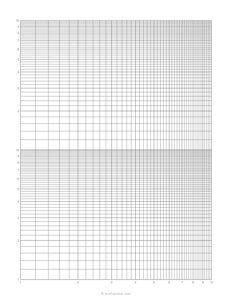
Log-Log Graph Paper (2 Cycles Y-Axis)
Download multi-cycle log-log graph paper with multiple logarithmic cycles on single or both axes. Ideal for engineering, physics, and large-scale scientific data.
view detailscategory: Logarithmic Graph Paper
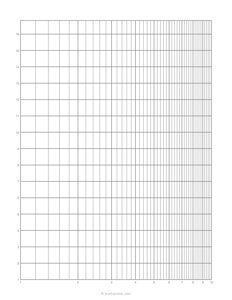
Semi-Log Graph Paper (X-Axis Logarithmic)
Download semi-log graph paper with a logarithmic scale on the X-axis and a linear Y-axis. Suitable for frequency plots, electronics, and time-based exponential data.
view detailscategory: Logarithmic Graph Paper
Log-Log Graph Paper (1 Cycle Each Axis)
Print log-log graph paper with one logarithmic cycle on both X and Y axes. Useful for power-law data, scaling relationships, and scientific modeling.
view detailscategory: Logarithmic Graph Paper
Log-Log Graph Paper (Multiple Cycles - 2×2)
Download multi-cycle log-log graph paper with multiple logarithmic cycles on single or both axes. Ideal for engineering, physics, and large-scale scientific data.
view detailscategory: Logarithmic Graph Paper
Semi-Log Graph Paper (1-Cycle on Y-Axis)
Download free printable semi-log graph paper with one logarithmic cycle on the Y-axis. Ideal for plotting exponential data, scientific measurements, and growth curves.
view detailscategory: Logarithmic Graph Paper
Browse our collection of free printable semi-log and log–log graph paper for scientific plotting, data analysis, and exponential charting.
Logarithmic graph paper is essential for representing exponential relationships, scientific measurements, frequency response curves, and complex engineering data. This category includes semi-log paper (logarithmic scale on one axis) and log–log paper (log scale on both axes), enabling precise plotting of data across multiple magnitudes.
Researchers, engineers, and students use log graph paper to visualize patterns and growth that linear scales cannot display effectively. With accurate logarithmic spacing and clear labeling, these templates support advanced data analysis in physics, electronics, chemistry, and statistics.